Verifying the implementation
The figure below overlays our port (lines) on the authors' MATLAB (open circles). Only once the port was verified did we substitute time for R&H's spatial axis and drive it with our delayed-onset stimulus (Figures 6–7).
Code & confirmation: our model code and verification harness · the confirmation figures and MATLAB diff on GitHub.
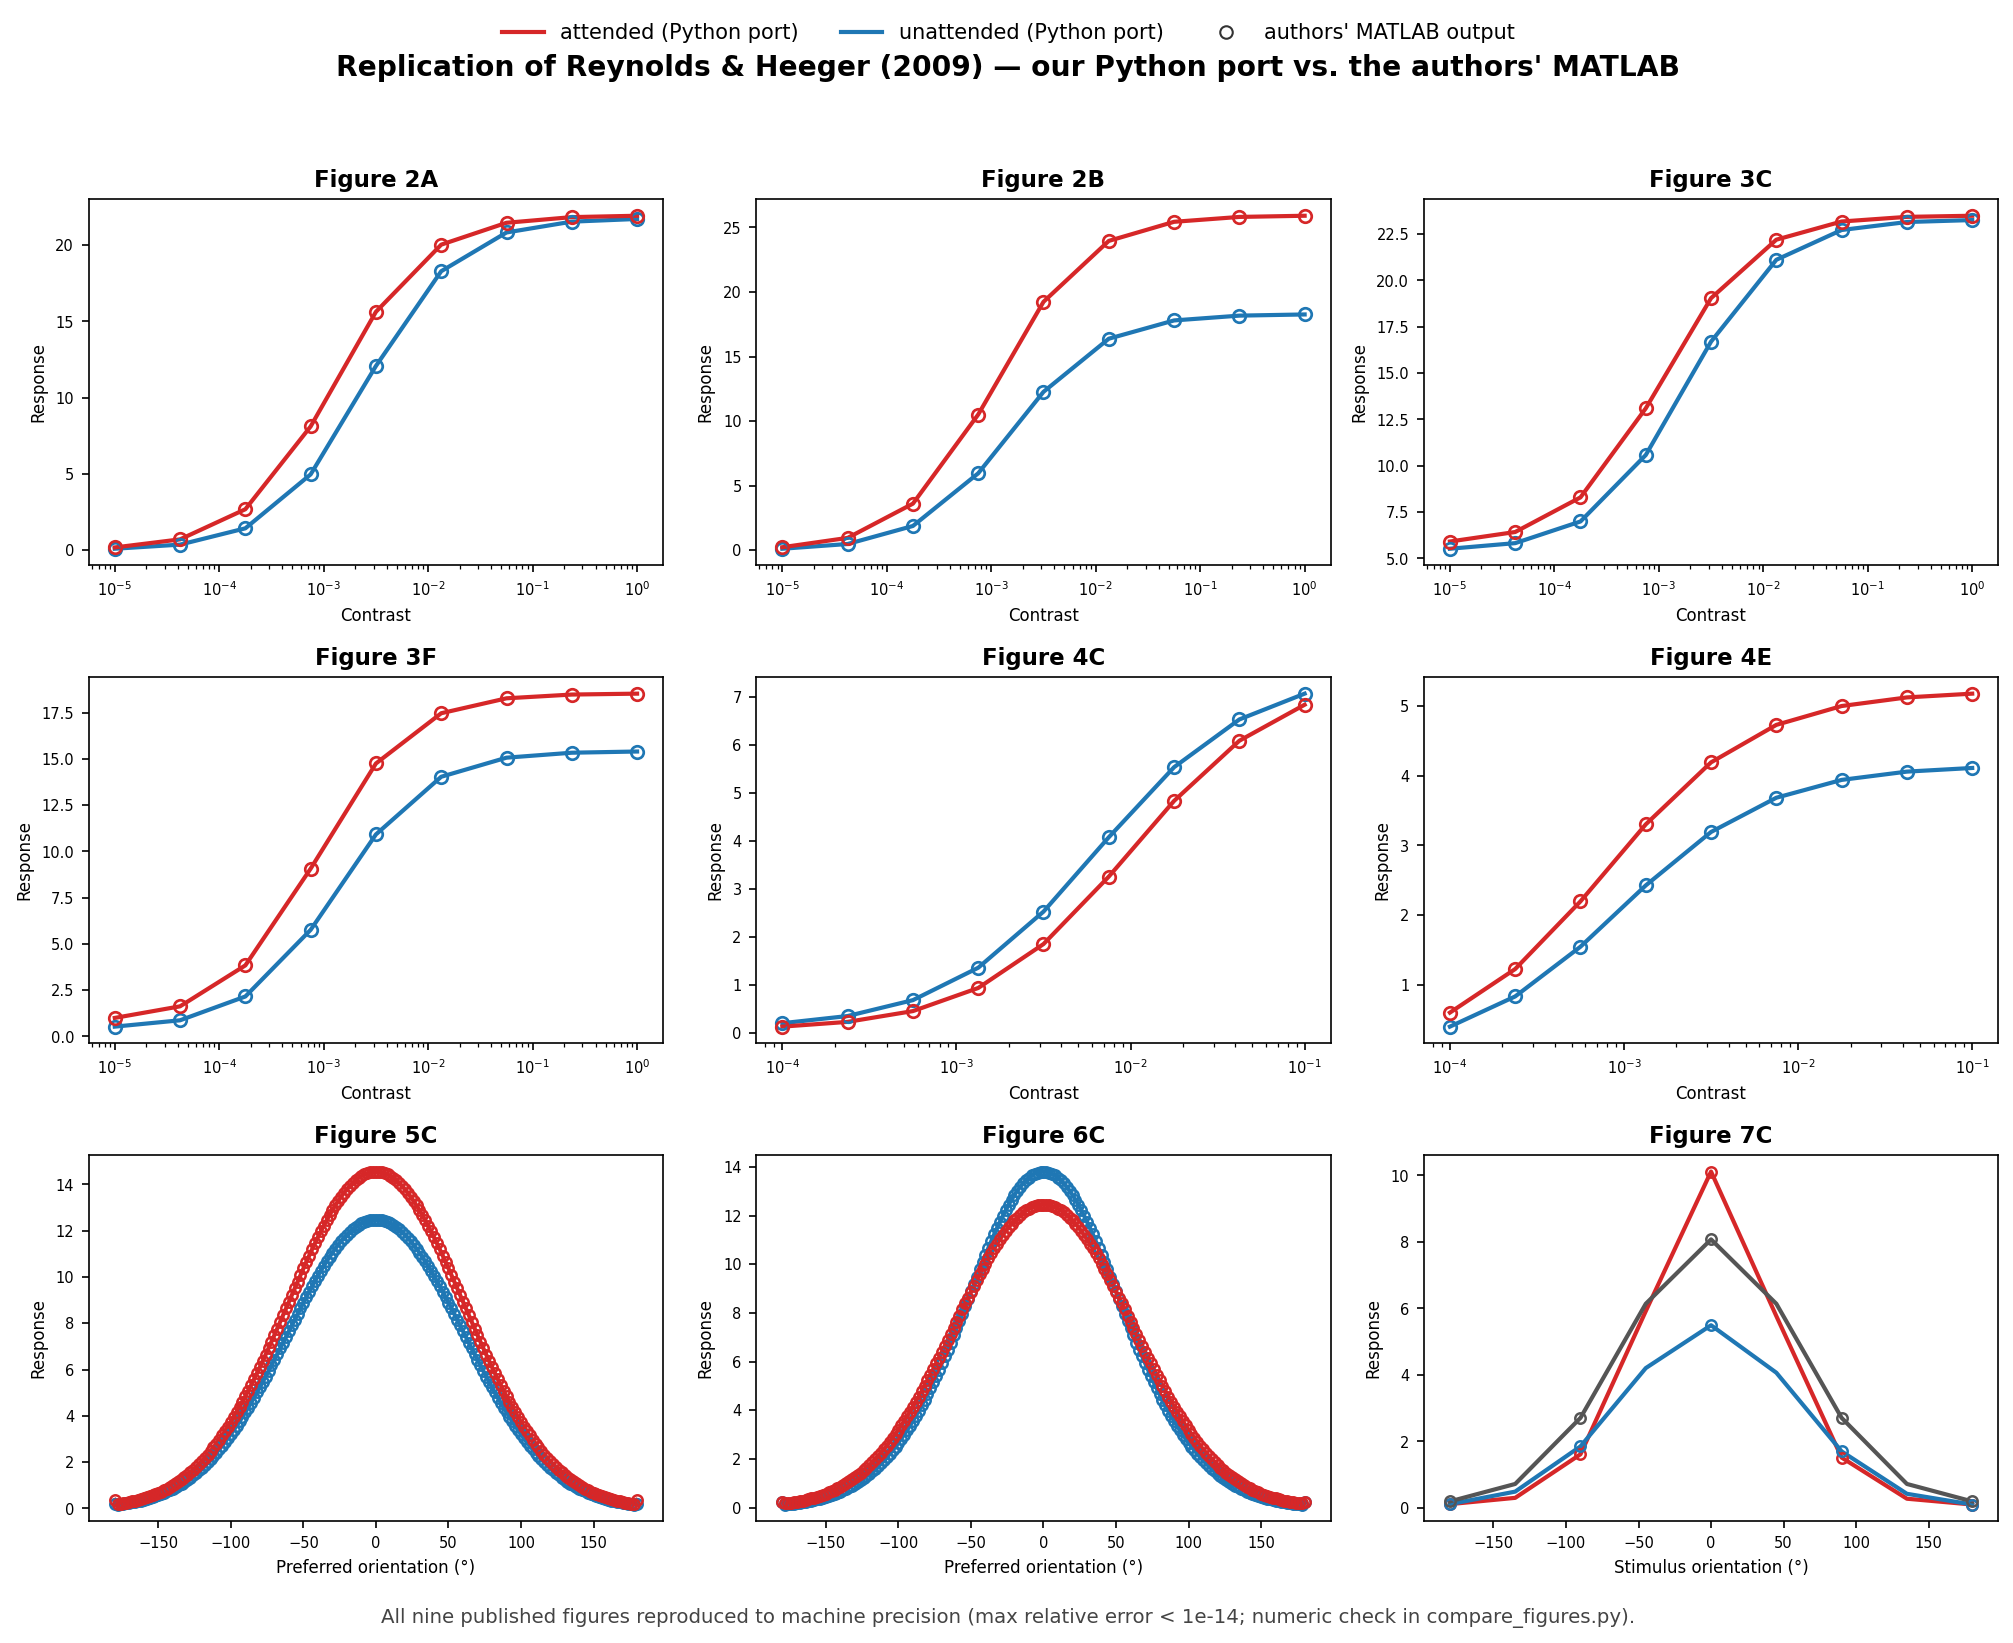
Figure 1. Our port reproduces all nine Reynolds & Heeger (2009) figures. Each panel re-runs one published case through our Python port of `attentionModel.m` (solid lines — attended in red, unattended in blue) and overlays the authors' own MATLAB output (open circles). Figures 2A–4E are contrast-response functions (response vs. log contrast, attention toward vs. away from the receptive field); 5C–6C are spatial/feature tuning curves; 7C is the orientation-variation result. The lines pass through the circles in every panel — agreement is to machine precision (max relative error < 10⁻¹⁴; the numeric check is in `compare_figures.py`).